When an AI agent diagnoses your Kafka in 2 minutes — what would take 90 minutes by hand
The first article showed three AI agents driving a 200-store supply chain on Kafka — they operated in the business flow: detecting stockouts, deciding replenishments, executing transfers. With MCP Confluent to call Kafka tools in natural language, the pipeline ran in 30 seconds what took 4 hours by hand.
For the details: Kafka replaces your middlewares — a 200-store supply chain run by 3 AI agents.
Different terrain here. The agents are no longer in the flow, they’re around it — on the ops side. A cluster that goes wrong, an incident to diagnose. The question is no longer “what to do?” but “what’s happening?”
In this article, we look at a real-world scenario:
- the system consuming invoices from Kafka stops without throwing an explicit error. On Kafka, a single malformed invoice—a “poison message”—blocks all subsequent processing.
- Without an agent, identifying the problematic offset requires 30 to 90 minutes of debugging using AKHQ, the CLI, and dashboards.
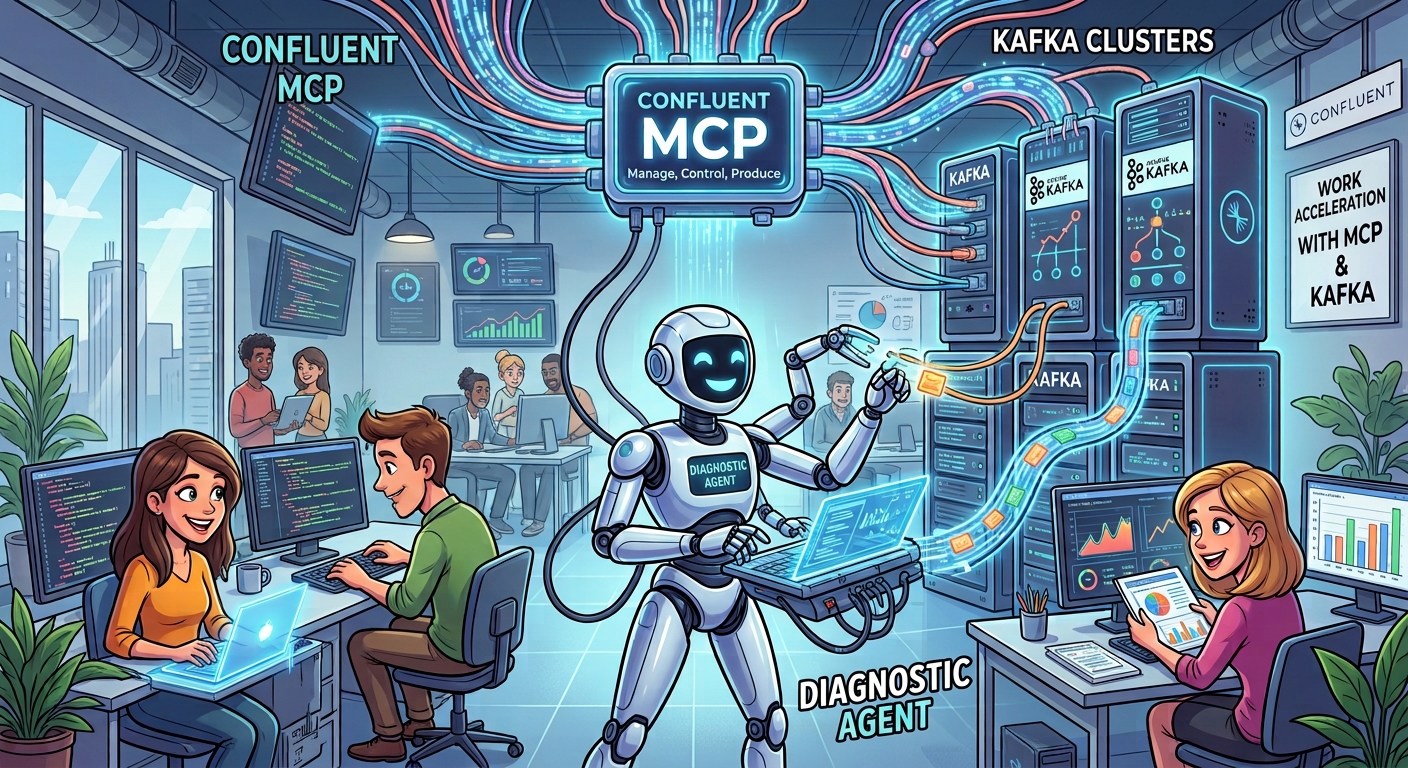
- With an ops agent connected to the Confluent MCP, the diagnosis takes just 2–3 minutes: four tool calls are enough to pinpoint the exact offset and the root cause.
- The fix itself remains manual—a 30-second CLI command. The agent doesn’t solve the problem; it eliminates the tedious part: the diagnosis.
In this article
1. The scenario — a poison message blocks billing
From the business side, the symptom is simple: invoices stop going out. The upstream system keeps producing them, but none reach billing anymore. No explicit error anywhere — just a technical alert flagging a processing delay.
For the team receiving the alert, the only information available is: “billing is blocked,” without knowing where or why.
This is a scenario I encounter regularly on the Kafka clusters I operate as a consultant — data platform for a major French retail player, dozens of consumer groups running live. A poison message blocking a critical flow without an explicit error is one of the most time-consuming incidents at this scale, precisely because nothing in the alert tells you where to look*.
On Kafka, each invoice is a message: a producer emits them on the
factures topic, and the facturation consumer group reads them one
by one to feed the billing system.
The cause of the blockage, once found, is almost always the same:
- An application bug emitted an invoice without the
siretfield - The message is valid in form, but incomplete for downstream processing
- This is what’s called a poison message: a message that crashes the consumer on every read attempt, effectively blocking everything that follows it
The application crashes in a loop on this message, never managing to move past it. Each invoice arriving after it piles up unprocessed, and this accumulating backlog is what technicians call lag. For the ops team, the alert just says “lag rising on facturation,” that’s it.
flowchart TD
    PROD[Producer emits normal invoices] -->|topic factures| PART[Partition 0]
    PROD_BUG[Producer bug: siret missing on 1 message] -->|offset 1452| PART
    PART -->|fetch| CG[Consumer group facturation]
    CG -->|crash parsing siret| CRASH[Consumer crash]
    CRASH -->|reconnect| CG
    CG -.->|offset stuck at 1452| STUCK[Lag keeps rising]
    STUCK --> ALERT[Alert: lag rising on facturation]
2. What really happens in ops without an agent
The alert lands in the ops channel: lag rising on facturation,
nothing else. Nothing indicates where to look. Here’s the real
playbook — one any Kafka SRE has lived through:
- The ops engineer opens AKHQ (Kafka’s web UI) or the CLI. They consume the latest messages from the topic, decode them by hand, look for the one that breaks. If they’re lucky, the poison message is in the last 100 — they find it in 30 min. If it’s further back, they iterate. 30 to 90 minutes lost.
- The ops engineer identifies the exact offset of the poison message — say 1452 on partition 0.
- The ops engineer runs the fix. A CLI command:
kafka-consumer-groups.sh --reset-offsets --to-offset 1453 --execute. 30 seconds. - The consumer resumes. The poison message is skipped.
The painful part is the diagnosis, not the fix. The fix is trivial — a 30-second command — but to run it, you need to know what to skip, which offset, which partition, why the message breaks. The investigation is what takes time. And that’s exactly what the agent does in 2-3 minutes.
3. Agentic diagnosis — four MCP calls, one exact diagnosis
What the agent does, in plain terms:
- It looks at the backlog (the lag)
- It reads the messages around the blocking point
- It identifies which one is faulty
The same approach an ops engineer would follow by hand, but executed in seconds rather than tens of minutes.
Technically, the ops agent is a google.adk.Agent connected to MCP
Confluent (@confluentinc/mcp-confluent) via HTTP SSE — a
gateway that lets it query Kafka with high-level tool calls instead of
writing Kafka code.
The diagnosis chains four MCP tool calls — two tools, called twice each, against the local Kafka cluster:
sequenceDiagram
    actor U as Operator
    participant A as Ops agent (ADK)
    participant M as MCP Confluent
    participant K as Kafka (factures)

    U->>A: facturation is blocked, why ?

    A->>M: get-consumer-group-lag group=facturation
    M->>K: AdminClient.listConsumerGroupOffsets
    K-->>M: committed offset P0=1451, lag=478
    M-->>A: lag per partition, P0 stagnant

    Note over A: 2nd call a few seconds later
    A->>M: get-consumer-group-lag group=facturation
    M-->>A: P0 lag identical → stagnant, not just a spike

    A->>M: consume-messages topic=factures partition=0 offset=1451
    M->>K: fetch from offset 1451
    K-->>M: message 1451 valid, message 1452 = siret missing
    M-->>A: poison message identified at offset 1452

    A->>M: consume-messages topic=factures partition=0 offset=1453 max=5
    M->>K: fetch 5 messages after the poison
    K-->>M: all valid
    M-->>A: no burst, 1 isolated message

    A-->>U: Poison message offset 1452 P0. Cause: siret missing. 1 isolated message.
The two tools that do all the work:
get-consumer-group-lag — MCP Confluent returns the **per-partition
lag** (log-end offset vs committed offset), not just group metadata. The agent calls it twice, a few seconds apart, to confirm the lag is stagnant — meaning the consumer isn’t progressing at all, not just running slow. This is the signal that distinguishes “poison message” from “temporary overload.”
consume-messages with precise offset seek — the agent reads messages
starting from the group’s committed offset (1451), finds the faulty message at 1452, then scans a few messages after (1453+) to distinguish an isolated message from a burst. It’s a detail an ops engineer handles mentally but never formalizes — the agent does it explicitly and reports it.
4. The exact command — and its critical precondition
The agent doesn’t stop at diagnosis. It formulates the exact command the ops engineer must run to skip the poison message:
kafka-consumer-groups.sh \
  --bootstrap-server broker1:9092 \
  --group facturation \
  --topic factures:0 \
  --reset-offsets \
  --to-offset 1453 \
  --execute
But there’s a catch. And the agent knows it.
--reset-offsets fails if the group has an active member — in
other words, if the crash-looping application is still running, the
reset command has no effect. If the consumer is in a crash/retry loop
without leaving the group, the command fails with:
Error: Assignments can only be reset if the group is inactive,
but the current state is Stable.
The agent therefore includes a precondition in its diagnosis:
Step 0 — stop the consumer process before the reset.
The
--reset-offsetscommand fails if thefacturationgroup has an active member. The consumer must be:
- stopped manually first,
- then the reset applied,
- then the consumer restarted.
A diagnosis that says “skip to offset 1453” without mentioning this precondition is incomplete: the ops engineer will try the command, it will fail, and they’ll waste another 10 minutes figuring out why.
5. The loop — the agent verifies the fix worked
The fix is manual — the ops engineer stops the consumer, runs the command, restarts the consumer. 30 seconds. But how do you know it worked?
Without an agent: the ops engineer goes back to AKHQ or Grafana, watches the lag drop, and confirms visually. Another 2-3 minutes.
With the agent: the loop closes on its own:
sequenceDiagram
    actor U as Operator
    participant A as Ops agent
    participant M as MCP Confluent
    participant K as Kafka

    U->>A: fix applied, verify
    A->>M: get-consumer-group-lag group=facturation
    M->>K: AdminClient.listConsumerGroupOffsets
    K-->>M: committed offset advanced, lag draining
    M-->>A: lag P0 = 12, dropping
    A-->>U: Fix verified. Lag dropping, consumer has resumed.
The agent calls get-consumer-group-lag again and confirms the lag
is dropping. In 10 seconds. The loop closes — diagnosis → human
action → agent validation — without the ops engineer going back to a
dashboard. This isn’t autonomy: the agent doesn’t fix anything, it
diagnoses then validates.
6. The quantified gain
For the business, the question is simple: how long does billing stay blocked? The answer, with or without an agent:
| Step | Time without agent | Time with agent | What stays human |
|---|---|---|---|
| Diagnosis | 30-90 min (AKHQ + CLI + manual decoding) | 2-3 min (4 MCP calls) | Read the diagnosis |
| Fix | 30 sec (CLI command) | 30 sec (same command) | Execute the command |
| Validation | 2-3 min (dashboard check) | 10 sec (MCP call) | — |
| Total | 33 min - 1h33 | ~3-4 min | — |
The blockage drops from an average range of 30 minutes to over an hour, down to 3 to 4 minutes.
What the agent doesn’t do, however, is just as important:
- It doesn’t modify the cluster
- It doesn’t touch any setting
- It doesn’t restart anything
The decision and the action remain entirely human — the ops engineer stays at the center of the fix, but arrives with an exact diagnosis, an identified cause, and a ready-to-run command, instead of starting from scratch.
This same shift — from time spent searching to time spent deciding — is what makes Kafka and AI agents useful together, whether on the business flow side or the ops side. On the business flow, the agent acts; here, it observes and proposes, never touching the cluster.
This boundary between reading and acting isn’t automatic — it was drawn by hand, tool by tool, for this specific scenario. The question that follows is: by what rules do we draw it at the scale of an entire cluster, without redesigning it by hand for every new agent? An attempt at an answer is the subject of the next article — governing agent autonomy on Kafka.
The PoC
kafka-ops-agentsimplements this loop locally. Theproblem-injectorcreates the poison message scenario (topicfactures, consumer groupfacturation, message withsiretmissing). The agent uses MCP Confluent forget-consumer-group-lagandconsume-messageswith offset seek — two tools against the Kafka KRaft 4.2.x Docker stack. The fix (offset reset) is simulated viaAdminClientin Python, with aSIMULATED:log to mark that the ops engineer decides, not the agent. The final validation is an MCP call.
References
- MCP Confluent — open-source MCP server exposing Kafka to AI agents: documentation · source code
- kafka-consumer-groups.sh — official documentation for the offset reset tool: Apache Kafka documentation
- PoC kafka-ops-agents — source code for the poison message scenario: github.com/arabaaoui/kafka-ops-agents
Previous article: Kafka replaces your middlewares — a 200-store supply chain run by 3 AI agents — MCP Confluent and KIP-932 in action on a retail supply chain use case.
Commentaires